
Get In Touch
Pudgy Squirrel Marketing
How Much Should a Roofing or Construction Company Spend on Marketing? (A No-BS Breakdown)
By Tony
June 12, 2026
11 mins
Share:
Key Takeaways
- Most roofing and construction companies either dramatically underspend on marketing (hoping word-of-mouth holds) or overspend in the wrong places (buying leads that don’t convert).
- The industry standard marketing budget benchmark is 5–10% of gross revenue but where you fall in that range depends on your growth stage, competitive market, and current digital infrastructure.
- Budget without strategy is just spending. The first question isn’t “how much?” it’s “what infrastructure do we have in place to actually convert what we’re about to spend?”
- A company with no website, no reviews, and no CRM will get dramatically worse results from the same dollar amount than one with those foundations in place.
- Google Ads and SEO serve fundamentally different functions one generates leads now, the other builds compounding value over time. Both belong in a mature marketing budget, but the ratio depends on your timeline.
- The most expensive marketing mistake contractors make isn’t overspending it’s underspending on conversion infrastructure while overspending on traffic generation.
The Question Every Contractor Eventually Asks
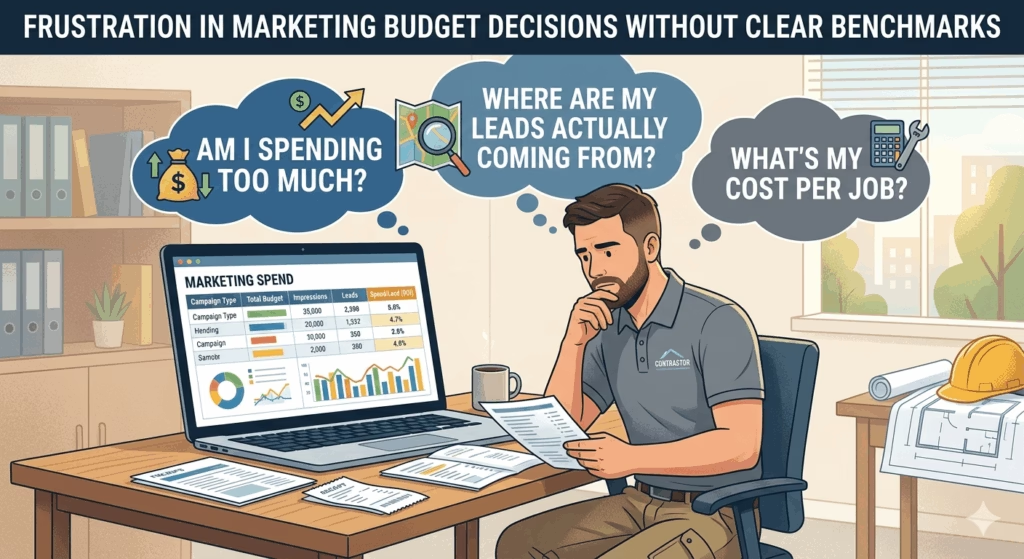
At some point, every roofing and construction company owner sits down and asks a version of the same question:
Am I spending too much on marketing? Too little? Is what I’m spending actually working?
It’s one of the most common frustrations in the trades and also one of the most underserved topics in contractor marketing content. Most of what exists online either gives a generic percentage with no context, or tries to upsell a particular service without addressing the underlying question honestly.
This post does neither. It gives you the real benchmarks, the real variables that affect those benchmarks, and a practical framework for deciding what your business should actually be spending right now, at the stage you’re in.
No fluff. No soft-pedaling. Just the breakdown.
The Industry Benchmark: Where It Comes From and What It Actually Means
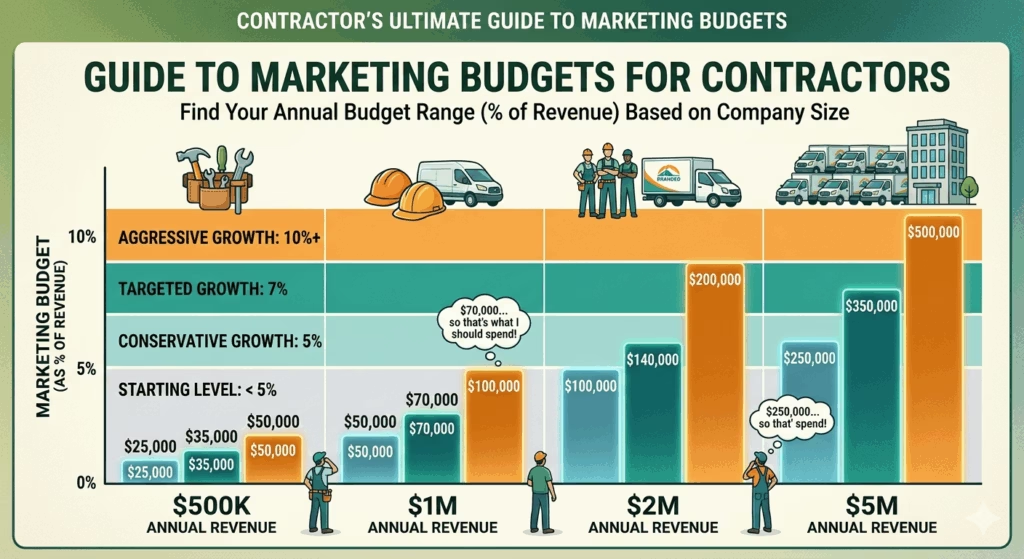
The most widely cited marketing budget benchmark across service industries is 5–10% of gross annual revenue.
For roofing and construction specifically, this range holds up but the right number within that range depends heavily on context. Here’s how to interpret it:
5% or lower is appropriate for:
- Established companies with strong word-of-mouth and a full referral pipeline
- Businesses in low-competition markets where organic visibility is already strong
- Companies in a maintenance phase rather than a growth phase
- Contractors who have already built owned marketing assets (strong website, 100+ reviews, established SEO rankings) that produce consistent leads with minimal upkeep spend
7–10% is appropriate for:
- Companies actively trying to grow market share
- Businesses entering new service areas or adding new service lines
- Companies in competitive urban or suburban markets with strong incumbent competition
- Contractors who are building their digital infrastructure for the first time
- Businesses recovering from a period of neglected marketing who need to reclaim visibility
Above 10% may be justified when:
- You are a newer company with no existing digital presence or reputation
- You’ve identified a specific high-ROI opportunity and need to move fast to capture it
- You’re in a category like storm restoration roofing where paid lead generation costs are high but margins are also high
- You’re making a one-time infrastructure investment (new website, CRM build-out) that temporarily inflates the percentage
The important caveat: These percentages are a starting point for conversation, not a formula. A $500,000 revenue roofing company spending 8% ($40,000/year) on marketing is in a very different position than a $3 million company spending 8% ($240,000/year). The percentage is the same. The absolute dollar amount and what it can actually accomplish is completely different.
Before the Budget Conversation: The Infrastructure Question
Here’s the thing most marketing budget conversations skip entirely and it’s the most important variable of all.
How much you spend matters far less than whether you have the infrastructure to convert what you’re spending.
Consider two contractors, each spending $3,000/month on Google Ads:
Contractor A sends all ad traffic to their homepage a slow-loading page with no clear CTA, two project photos, and a contact form that nobody checks promptly. No CRM. No follow-up sequence. Lead comes in, sits in an inbox for six hours, prospect books with someone else.
Contractor B sends ad traffic to dedicated service landing pages fast-loading, mobile-optimized, with prominent phone numbers, a simple estimate form, and a CRM that fires an automatic response within 60 seconds and triggers a five-touch follow-up sequence over two weeks.
Same $3,000. Dramatically different results. Not because of the ad campaign because of the infrastructure behind it.
Before you ask “how much should I spend on marketing?”, answer these questions honestly:
- Website: Is it mobile-optimized, fast-loading, and does it have a clear path to contact on every page?
- Landing pages: Do you have dedicated pages for each service you offer, or is everything funneled to a generic services page?
- Response time: When a lead comes in, how quickly does someone respond? Minutes? Hours? Days?
- Follow-up: Do you have a systematic follow-up process, or does follow-up depend on whoever happens to remember?
- Reviews: How many Google reviews do you have? Is your rating above 4.5 stars?
- Tracking: Do you know which marketing channels are generating your booked jobs, or are you guessing?
If the honest answers to most of these questions are “no,” “I don’t know,” or “it varies” your immediate priority isn’t increasing your marketing budget. It’s fixing the foundation so that the budget you already have starts working.
Spending more on traffic generation when your conversion infrastructure is broken is like pouring water into a bucket full of holes. Fix the holes first.
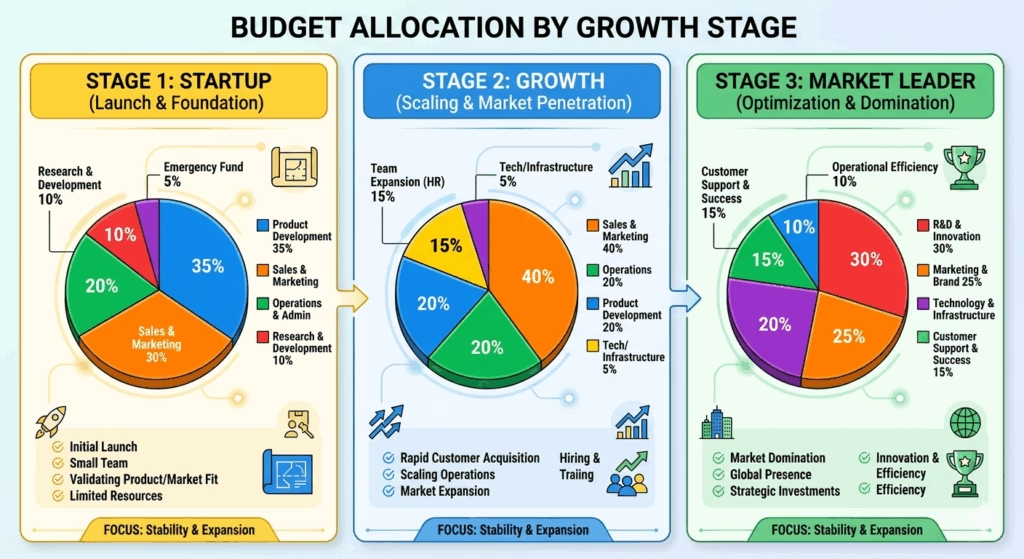
A Realistic Budget Breakdown by Company Stage
Rather than a single number, here’s how marketing budgets should be structured at different stages of a roofing or construction company’s growth.
Stage 1: The Startup or Restart ($0–$500K Annual Revenue)
At this stage, cash is tight and every dollar has to work. The temptation is to spend nothing on marketing and rely entirely on referrals and word-of-mouth. This works in the short term and stalls growth in the medium term.
Realistic total marketing budget: $1,500–$3,500/month
Recommended allocation:
| Channel | Monthly Budget | Purpose |
|---|---|---|
| Website (one-time build, amortized) | $300–$500 | Foundation for all other marketing |
| Google Business Profile optimization | $200–$400 | Free traffic from local search |
| Google Ads (targeted, narrow geo) | $500–$1,000 | Immediate lead flow while SEO builds |
| Social media (organic + basic paid) | $200–$500 | Brand presence and local awareness |
| Review generation system | $100–$200 | Trust signals that improve all conversion |
| CRM / follow-up automation | $150–$300 | Ensure leads actually get converted |
Priority at this stage: Get the foundations right. A professional website, an optimized Google Business Profile, and a basic CRM cost relatively little and dramatically improve the return on every other dollar you spend. Don’t pour budget into lead generation before these are in place.
Stage 2: The Growth Phase ($500K–$2M Annual Revenue)
You have a proven service, a functional team, and capacity to take on more work. The goal now is scaling lead flow without sacrificing quality or margins.
Realistic total marketing budget: $4,000–$10,000/month
Recommended allocation:
| Channel | Monthly Budget | Purpose |
|---|---|---|
| SEO (ongoing) | $1,000–$2,500 | Build long-term organic lead flow |
| Google Ads | $1,500–$3,000 | Immediate, high-intent lead generation |
| Website maintenance + CRO | $300–$600 | Continuously improve conversion rates |
| Social media (managed) | $500–$1,000 | Brand building + local engagement |
| Facebook/Instagram Ads | $500–$1,500 | Awareness and retargeting |
| CRM + automation | $200–$400 | Pipeline management and follow-up |
| Content and reputation management | $300–$600 | Reviews, blog, GBP posts |
Priority at this stage: SEO becomes a significant investment at this stage because the compounding returns justify it a company that started serious SEO 12 months ago is generating leads at a fraction of the cost-per-acquisition of paid channels. If you haven’t started, start now. Also: if your close rate on existing leads is below 30%, fix the conversion system before adding more lead volume.
Stage 3: The Market Leader Phase ($2M+ Annual Revenue)
At this revenue level, you have the budget to operate across all channels simultaneously and the team infrastructure to handle the lead flow. The focus shifts from “generating enough leads” to “dominating your market and defending your position.”
Realistic total marketing budget: $12,000–$25,000+/month
Recommended allocation:
| Channel | Monthly Budget | Purpose |
|---|---|---|
| SEO (aggressive) | $2,500–$5,000 | Own first-page rankings across all services |
| Google Ads | $3,000–$8,000 | High-volume, high-intent lead capture |
| Website + landing page optimization | $500–$1,000 | Continuous conversion improvement |
| Social media management + paid | $1,500–$3,000 | Brand authority + lead gen |
| Content marketing (blog, video) | $1,000–$2,000 | Topical authority and organic traffic growth |
| CRM + full marketing automation | $500–$1,000 | Pipeline management at scale |
| Reputation management | $500–$1,000 | Maintaining and growing review volume |
| Email marketing to past customers | $300–$600 | Retention and referral activation |
Priority at this stage: The competitive moat at this level is built on owned assets SEO rankings, review volume, and brand recognition that makes your company the default choice before a buyer even starts comparing options. Paid channels support and amplify this position; they’re no longer the primary growth driver.
The Cost-Per-Lead Deception (And What to Track Instead)
One of the most misused metrics in contractor marketing is cost-per-lead (CPL). It’s intuitive you divide your marketing spend by the number of leads generated and compare across channels. Lower CPL = better channel. Right?
Not necessarily.
A shared lead from a third-party platform might cost $35 per lead. An SEO-generated lead from your own website might cost $120 per lead (when you factor in the monthly SEO investment against lead volume). On paper, the platform lead looks three times more efficient.
But if the platform lead converts at 12% and the SEO lead converts at 45%, the actual cost per booked job tells a completely different story:
- Platform: $35 ÷ 12% = $292 per booked job
- SEO: $120 ÷ 45% = $267 per booked job
The “more expensive” lead is actually cheaper per job acquired. And the SEO lead also skews toward higher-value projects, generates a customer with higher lifetime value, and doesn’t require competing with three other contractors who received the same lead simultaneously.
The metrics that actually matter:
- Cost per booked job (CPJ): Total marketing spend ÷ number of jobs booked from that channel
- Revenue per marketing dollar: Total revenue from booked jobs ÷ marketing spend that generated them
- Close rate by source: What percentage of leads from each channel become paying customers?
- Average job value by source: Which channels send you customers who buy larger projects?
- Customer lifetime value by source: Which channels produce customers who refer, return, and review?
Tracking these requires a CRM that tags every lead by source and follows the customer through to job completion and beyond. Without this tracking infrastructure, you’re making budget decisions based on incomplete and often misleading data.
This is one of the core functions a CRM built for construction and roofing businesses handles connecting lead source to revenue outcome so you can see exactly which marketing dollars are producing real business growth versus which are generating activity with no return.
The Most Common Marketing Budget Mistakes Contractors Make
Mistake 1: Spending on Traffic Before Fixing Conversion
Covered earlier, but worth repeating: more traffic to a leaky website produces more wasted spend, not more booked jobs. Audit your conversion infrastructure before increasing any traffic budget.
Mistake 2: Treating All Channels as Equivalent
Google Ads and SEO are not the same thing funded at different levels. They serve different functions on different timelines:
- Google Ads produces leads immediately and stops the moment you stop paying. It’s a faucet.
- SEO takes 4–9 months to build meaningful results, but those results compound over time and continue producing even when active spending slows. It’s an asset.
A mature marketing budget needs both. A startup budget may need to lean on ads in the short term while SEO is building but cutting SEO entirely to fund more ads is almost always the wrong tradeoff over a 12-month horizon.
Mistake 3: Buying Leads Instead of Building Infrastructure
Third-party lead services are not a marketing strategy they’re a stopgap. When you buy leads from an aggregator, you’re renting someone else’s marketing infrastructure. You own nothing. The moment you stop paying, the pipeline is gone.
The same dollars invested in your own website, SEO, and Google Business Profile build owned assets that produce leads indefinitely. The first 12 months of owned infrastructure investment often feels slower than buying leads and the following 12–36 months are substantially more profitable.
Mistake 4: Not Tracking Attribution
“I’m not sure where my leads come from” is one of the most common things contractors say and one of the most expensive problems to ignore. If you can’t tie revenue to specific marketing channels, you cannot make rational budget allocation decisions.
Set up Google Analytics on your website. Use unique phone numbers for different campaigns. Track lead source in your CRM. Review this data monthly. This is how you make budget decisions based on actual performance rather than instinct.
Mistake 5: Going Dark When Business Is Good
Many contractors cut their marketing budget when they’re busy and ramp it back up when things slow down. This feels logical why spend money on leads when you’re already booked out?
The problem: marketing takes time to produce results. The pipeline you’re benefiting from this month is the result of marketing decisions made three to six months ago. If you go dark when you’re busy, you’re guaranteeing a dry spell in three to six months when the pipeline that existed before you cut runs dry.
The most successful contractors maintain consistent marketing spend through their busy seasons so the pipeline never runs empty.
How to Think About Your First Marketing Budget Conversation
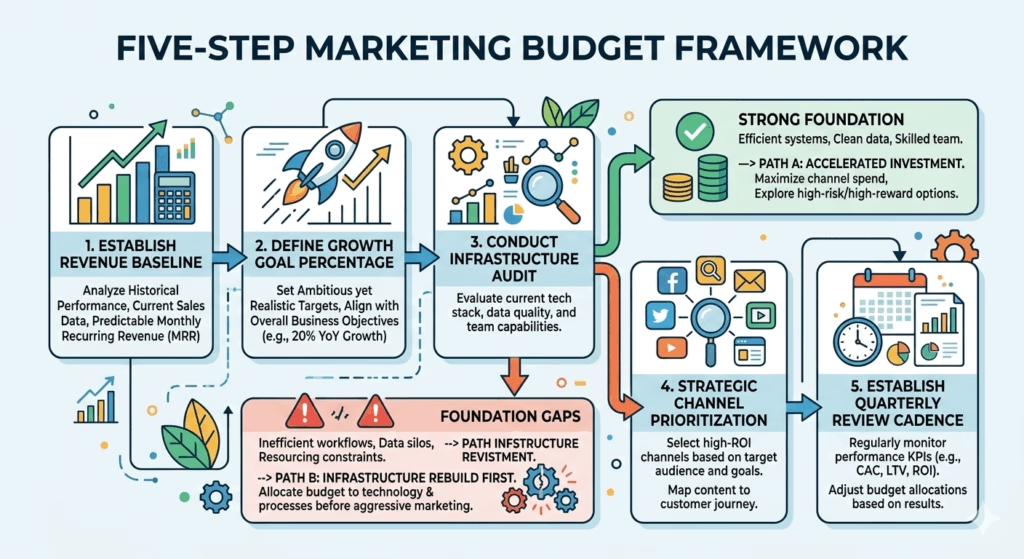
If you’ve never had a structured marketing budget before or if you’re reassessing one that isn’t producing here’s a practical framework for the conversation:
Step 1 — Establish your revenue baseline. What did the business generate in the last 12 months? This is your starting denominator.
Step 2 — Apply the benchmark percentage to your growth goal. If you want to grow revenue by 20% next year, apply 7–10% to your target revenue not your current revenue. Marketing investment should be sized to where you’re going, not where you’ve been.
Step 3 — Audit your infrastructure honestly. Score your website, your follow-up system, your review profile, and your tracking capability. If multiple areas are weak, allocate budget to fix those before increasing traffic spend.
Step 4 — Prioritize channels based on your timeline. Need leads in the next 30 days? Lean on Google Ads and a tightened follow-up sequence. Building for the next 12–24 months? SEO and a strong Google Business Profile should be your primary investments.
Step 5 — Set a review cadence. Marketing budgets should be reviewed and adjusted quarterly not annually. Monthly data is meaningful. Annual adjustments are too slow to respond to what’s working and what isn’t.
A comprehensive marketing strategy built for roofing and construction companies walks through all of these steps with your specific revenue, market, and growth targets in mind so the budget you land on is based on your actual situation, not a generic industry average.
The Real ROI Question: What Should You Expect Back?
No budget conversation is complete without addressing the return side of the equation.
Realistic ROI benchmarks for contractor marketing investments when the infrastructure is in place and the strategy is sound look something like this:
Google Ads (well-managed): Cost per booked job typically ranges from $200–$600 depending on market competition and average job value. For a roofing company averaging $8,000–$12,000 per job, this is a 15–40x return on ad spend for the booked job alone before accounting for reviews and referrals from that customer.
SEO (12–18 months in): Organic leads typically cost 40–70% less per booked job than paid leads over the life of the campaign, once the initial build period is complete and rankings are established.
CRM and follow-up automation: The ROI here is often the most immediate and dramatic. Contractors who implement a proper follow-up system typically see close rates improve by 15–25 percentage points on their existing lead volume with no increase in marketing spend. If you’re generating 30 leads a month and closing 8, improving your close rate to 12 represents a 50% revenue increase from the same marketing budget.
These returns are not guaranteed they depend on execution quality, market conditions, and how well the overall system is integrated. But they represent what’s achievable when the budget is allocated intelligently and the infrastructure supports it.
A good SEO strategy and lead generation system doesn’t just generate traffic it generates traffic that your website and follow-up system are positioned to convert into revenue.
The Bottom Line: Spend With Intention, Not Desperation
The contractors who win with their marketing budget aren’t necessarily the ones spending the most. They’re the ones spending with the most intention clear on what each dollar is supposed to accomplish, what success looks like, and what they’ll do with the data they get back.
Underspending on marketing because it feels like a cost rather than an investment is the choice that keeps good companies small. Overspending on low-quality lead generation because it’s easy is the choice that keeps busy companies unprofitable.
The right number is the one that’s sized for your growth goals, allocated across channels appropriate to your stage, and backed by infrastructure capable of converting what you generate.
That number is different for every company. But the framework for finding it is the same and now you have it.
Why Schedule a Call?
Popular Insights
The Anatomy of a High-Converting Contractor Website: What Customers Actually Look for Before Calling
Jul. 24, 2026
Seasonal Marketing: How Smart Contractors Stay Busy in the Slow Season
Jul. 17, 2026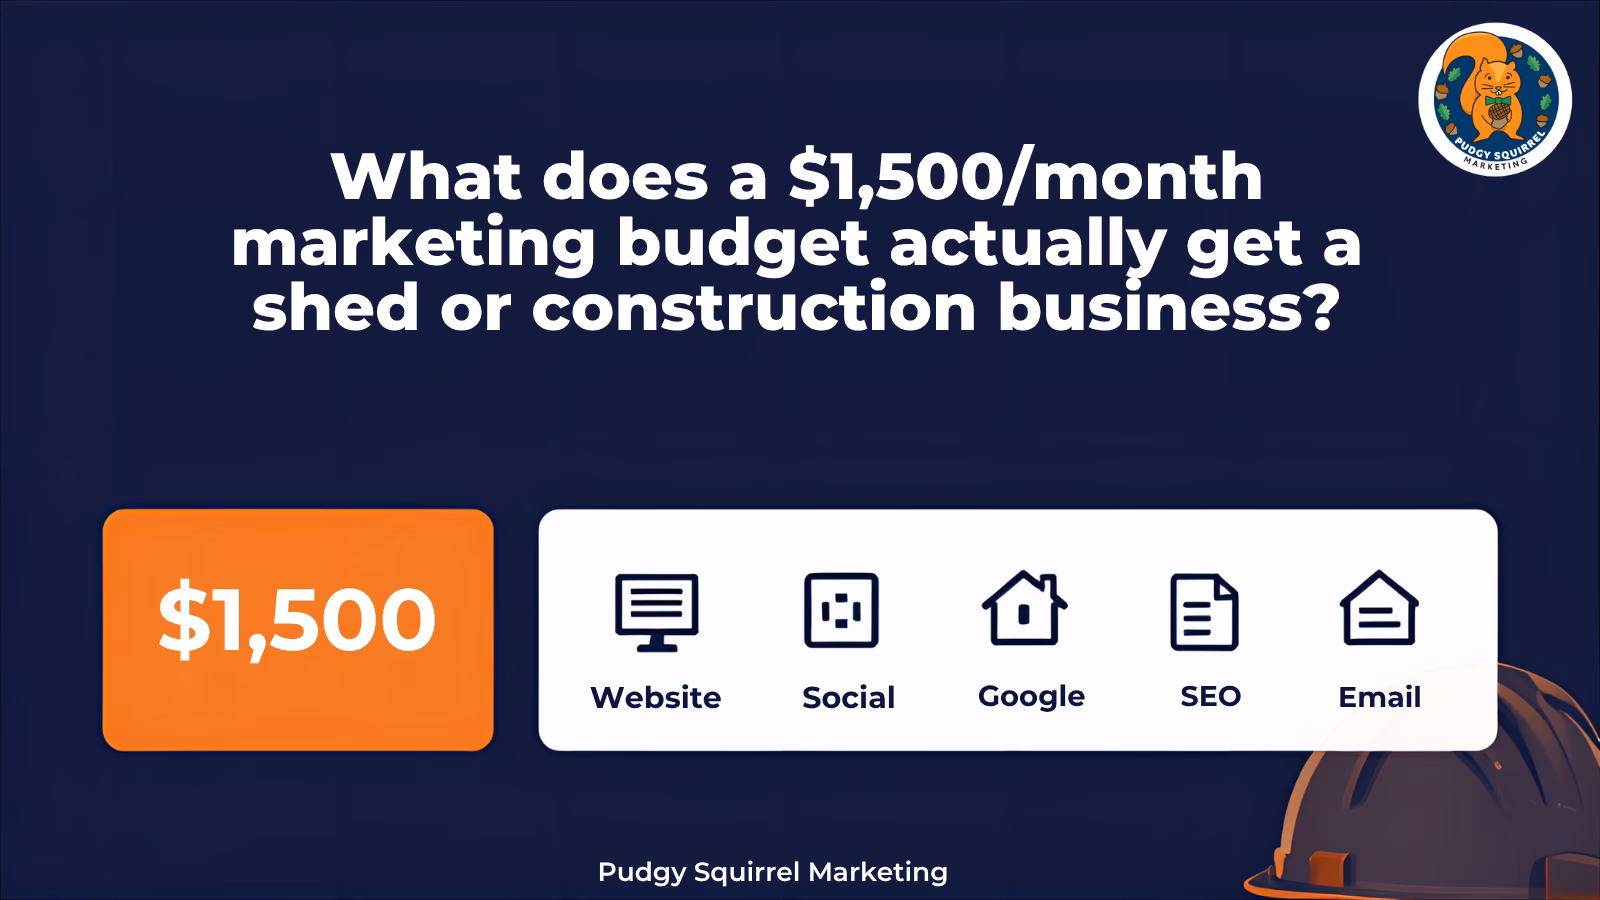
What Does a $1,500/Month Marketing Budget Actually Get a Shed or Construction Business?
Jul. 10, 2026
DIY vs. Agency: Should a Roofing Company Handle Their Own Marketing?
Jul. 03, 2026
7 Signs Your Construction Company’s Website Is Losing You Jobs (And How to Fix It)
Jun. 26, 2026Topics

Pudgy Squirrel Marketing
The Anatomy of a High-Converting Contractor Website: What Customers Actually Look for Before Calling
Read More
Pudgy Squirrel Marketing
Seasonal Marketing: How Smart Contractors Stay Busy in the Slow Season
Read More
Pudgy Squirrel Marketing
What Does a $1,500/Month Marketing Budget Actually Get a Shed or Construction Business?
Read More
Pudgy Squirrel Marketing
DIY vs. Agency: Should a Roofing Company Handle Their Own Marketing?
Read More
Pudgy Squirrel Marketing
7 Signs Your Construction Company’s Website Is Losing You Jobs (And How to Fix It)
Read More
Pudgy Squirrel Marketing
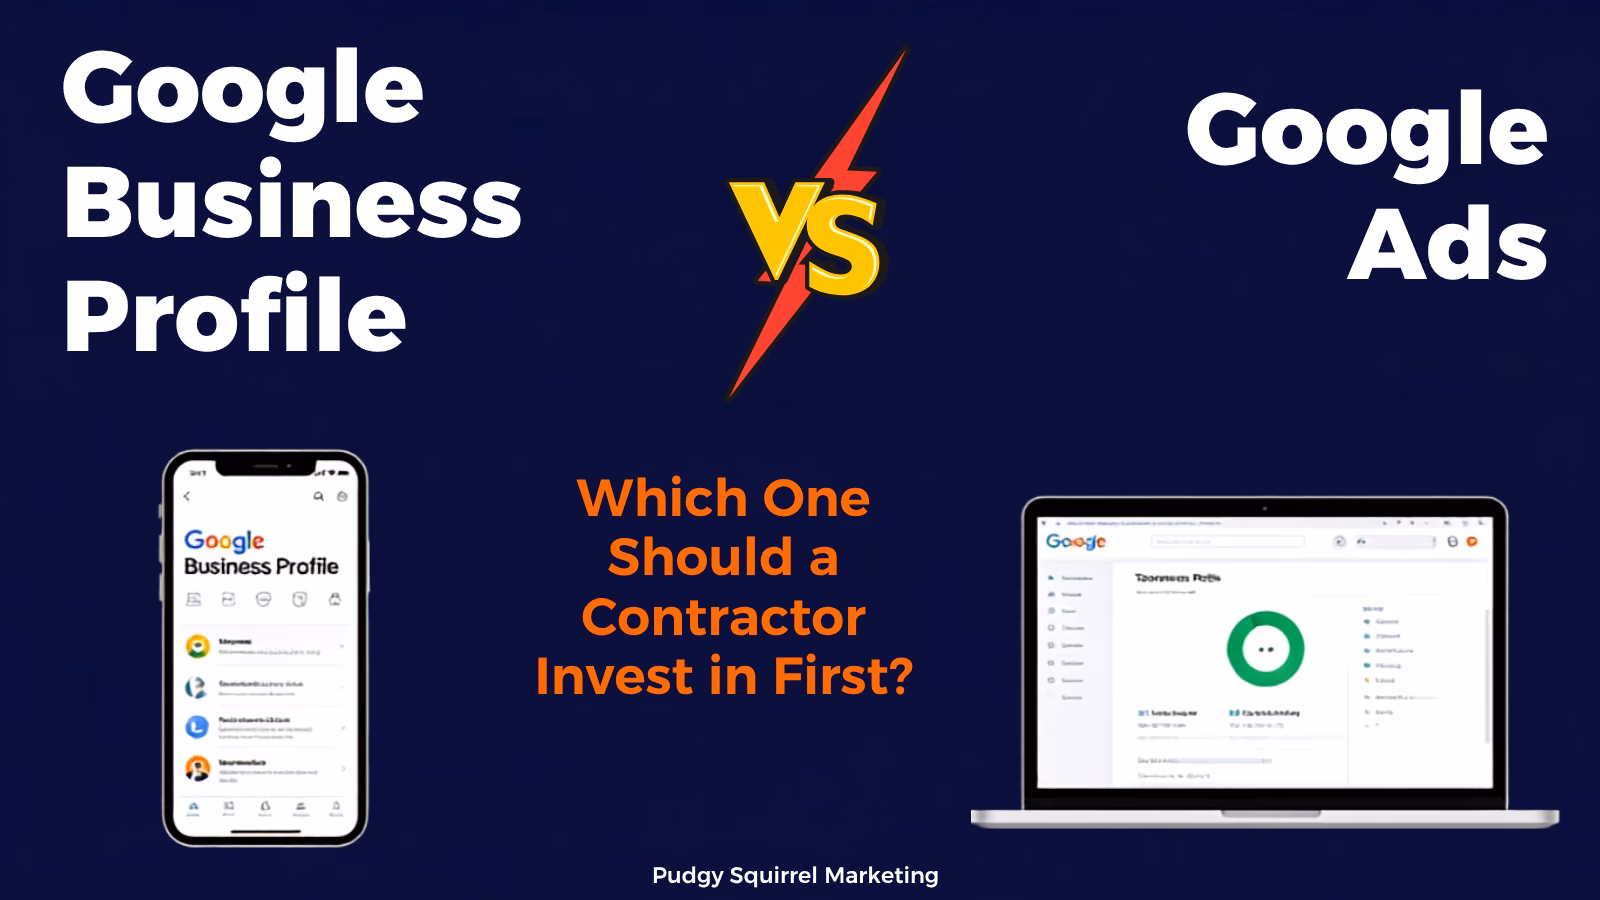
Google Business Profile vs. Google Ads: Which One Should a Contractor Invest in First?
Read More
Pudgy Squirrel Marketing
How Much Should a Roofing or Construction Company Spend on Marketing? (A No-BS Breakdown)
Read More

Pudgy Squirrel Marketing
The Before-and-After Effect: Why Project Photos Are Your Best Marketing Asset as a Builder
Read More